Introduction to Research Findings
Research findings are the backbone of evidence-based decisions across industries, academia, and policymaking. They represent the results derived from systematic investigation, experiments, or surveys. Whether you are conducting scientific studies, market research, or social analysis, understanding research findings is crucial for translating data into actionable insights.
What Are Research Findings?
Research findings are the conclusions drawn from collected data after rigorous analysis. They can be:
Quantitative findings: Numerical data presented as statistics, charts, or graphs.
Qualitative findings: Insights from interviews, case studies, or observations.
Mixed-method findings: A combination of numerical and descriptive results.
Key characteristics of strong research findings include clarity, accuracy, relevance, and reproducibility. They are often published in journals, reports, or organizational summaries to inform future studies and decision-making.
Importance of Research Findings
Understanding and utilizing research findings offers several advantages:
Informed Decision-Making – Organizations and policymakers rely on research findings to guide strategies and allocate resources effectively.
Evidence-Based Practices – In fields like healthcare, education, and technology, research findings support best practices.
Innovation and Development – Identifying trends and gaps in research findings encourages innovation and product development.
Transparency and Accountability – Publishing research findings ensures that decisions and policies are transparent and can be critically evaluated.
Types of Research Findings
Research findings can be classified into various types, depending on the methodology and data analyzed:
1. Descriptive Findings
These summarize the main features of a dataset. Examples include mean scores, percentages, and frequency counts.
2. Inferential Findings
Used to make predictions or generalizations about a population based on sample data, including regression analysis and hypothesis testing.
3. Exploratory Findings
Provide initial insights into under-researched areas, often forming the basis for further studies.
4. Correlational Findings
Reveal relationships between variables but do not necessarily indicate causation.
How to Analyze Research Findings
Analyzing iresearch findngs effectively involves several steps:
Organize the Data – Arrange the results logically using tables, charts, or diagrams.
Interpret Results – Understand patterns, trends, and anomalies in the data.
Compare with Literature – Relate findings to existing research to identify consistencies or discrepancies.
Draw Conclusions – Summarize key insights, highlighting their relevance and potential applications.
Present Clearly – Use visual aids and concise language to communicate findings to stakeholders.
Best Practices for Reporting Research Findings
Clarity – Avoid jargon and present findings in a reader-friendly format.
Accuracy – Ensure data integrity and correct interpretation of results.
Contextualization – Explain findings within the scope and limitations of the study.
Reproducibility – Provide sufficient detail so others can replicate the research.
Ethical Considerations – Maintain transparency, avoid bias, and acknowledge sources.
Common Mistakes to Avoid
Overgeneralizing results beyond the studied population.
Ignoring outliers or contradictory data.
Presenting findings without supporting evidence or context.
Confusing correlation with causation.
Applications of Research Findings
Research findings are widely applied in various sectors:
Healthcare: Guiding clinical practices and policy decisions.
Business: Shaping marketing strategies and product development.
Education: Improving teaching methods and curriculum design.
Social Sciences: Influencing social policies and community programs.
Technology: Driving innovation and user experience enhancements.
Conclusion
Research findings are more than just data—they are insights that empower decision-makers, inspire innovation, and shape our understanding of the world. Properly analyzing, interpreting, and presenting these findings ensures they have a meaningful impact across all fields.
By prioritizing clarity, accuracy, and relevance, researchers and organizations can maximize the value of their research findings, ensuring that knowledge translates into action.
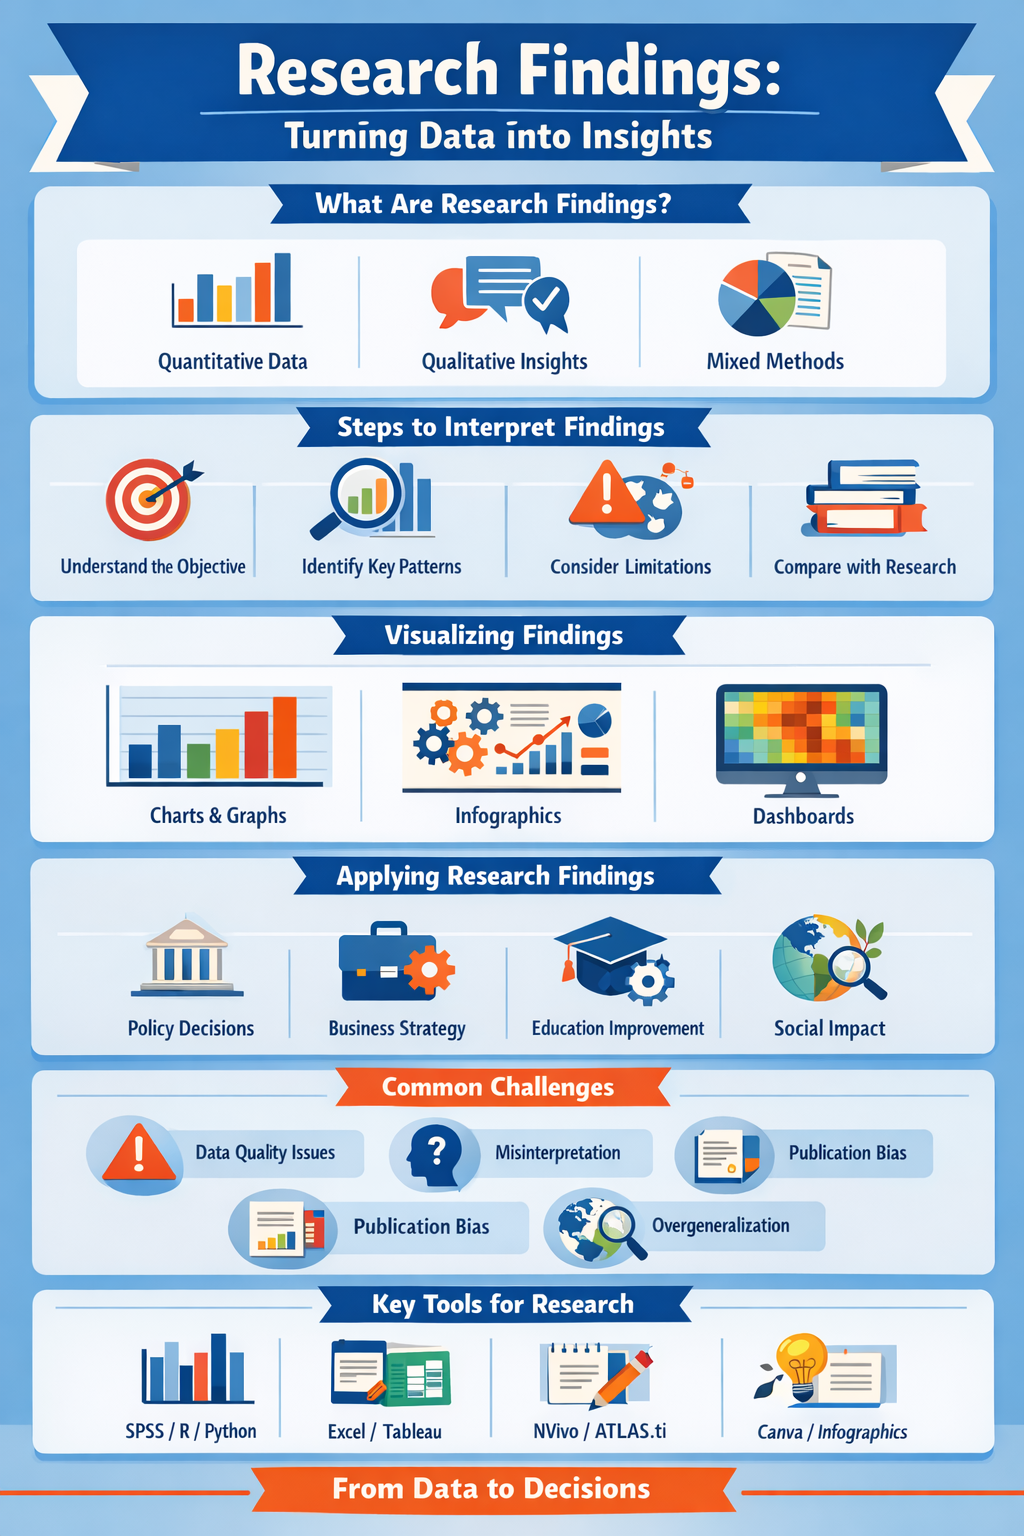
How to Interpret Research Findings
Interpreting research findings requires a careful understanding of both the data and the context of the study. Misinterpretation can lead to flawed decisions. Here’s how to approach it effectively:
1. Understand the Objective
Before diving into the results, revisit the research questions or hypotheses. Ask:
What problem was the research trying to solve?
What variables or factors were measured?
Who or what is the population/sample?
2. Identify Key Patterns
Look for trends, differences, or correlations in the data. Key indicators include:
Statistical significance: Determines whether results are likely due to chance.
Effect size: Measures the strength of a relationship.
Trends over time: Useful in longitudinal studies or market analysis.
3. Consider Limitations
Every research study has limitations. Interpreting findings responsibly means acknowledging:
Sample size constraints
Potential biases in data collection
External factors that may have influenced results
4. Compare With Previous Research
Relate your findings to existing literature. Are they consistent with prior studies, or do they reveal new insights? This comparison strengthens credibility and helps identify research gaps.
Visualizing Research Findings
A critical step in making research findings actionable is visualization. Properly presented results are easier to understand and communicate. Common methods include:
Tables and charts: Summarize quantitative results clearly.
Graphs: Line graphs, bar charts, and scatter plots highlight trends and relationships.
Infographics: Combine visuals and text for quick comprehension.
Heatmaps and dashboards: Useful in business and technology research for monitoring metrics.
Pro Tip: Always label your visuals clearly and include units of measurement. This prevents misinterpretation and enhances trustworthiness.
Using Research Findings for Decision-Making
Once research findings are interpreted and visualized, the next step is application. Practical uses include:
Policy Formulation
Governments and organizations use research findings to draft informed policies. For example, public health studies influence vaccination campaigns and disease prevention programs.Business Strategy
Companies rely on market research findings to improve products, target customers, and predict trends. For instance, analyzing consumer behavior can lead to more effective advertising campaigns.Educational Improvement
Educators use research findings to enhance teaching strategies, curriculum design, and student engagement approaches.Innovation and Technology
Research findings in tech industries help improve software, hardware, and user experience by identifying gaps and opportunities.Social and Environmental Impact
Nonprofits and social organizations use research findings to advocate for change, measure program effectiveness, and allocate resources efficiently.
Reporting Research Findings Effectively
Communicating research findings is as important as conducting the study. An effective report ensures clarity and credibility. Key tips include:
Executive Summary: Highlight main findings for quick understanding by stakeholders.
Structured Format: Organize sections by methods, results, discussion, and conclusion.
Clarity and Simplicity: Avoid jargon, explain technical terms, and use visuals.
Actionable Insights: Emphasize recommendations based on findings.
References: Cite sources and methodologies to enhance reliability.
Example: A market research report may present findings on consumer preferences, followed by clear recommendations for product improvements and marketing strategies.
Real-Life Example of Research Findings
Imagine a study on remote work productivity. Research findings might reveal:
Employees working remotely report a 20% increase in productivity compared to office-based work.
Flexible hours lead to higher job satisfaction but require structured communication tools.
Teams using project management software consistently meet deadlines, unlike those without digital tools.
Application: Companies can use these findings to implement hybrid work policies, adopt productivity tools, and improve employee satisfaction.
Common Challenges in Research Findings
While research findings are invaluable, there are challenges to consider:
Data Quality Issues: Inaccurate or incomplete data can lead to misleading conclusions.
Misinterpretation: Stakeholders may draw incorrect conclusions without proper context.
Publication Bias: Studies with positive findings are more likely to be published, skewing the available evidence.
Overgeneralization: Findings from a small sample should not be applied broadly without caution.
Solution: Always combine careful analysis, transparency, and critical thinking when interpreting and reporting research findings.
Tools to Enhance Research Findings
Several tools can help researchers analyze and present findings effectively:
SPSS / R / Python: For statistical analysis and data modeling.
Excel / Google Sheets: For basic data organization and charting.
Tableau / Power BI: For interactive dashboards and visualization.
NVivo / ATLAS.ti: For qualitative research coding and analysis.
Canva / Piktochart: For infographics and presentation of findings.
Using these tools enhances clarity, supports evidence-based decisions, and makes findings more engaging for audiences.
Conclusion
Research findings are essential for transforming data into meaningful insights. By understanding, analyzing, visualizing, and applying them responsibly, organizations and individuals can make informed decisions, drive innovation, and influence positive change.
Remember: the value of research findings lies not only in discovery but also in application. Accurate, transparent, and actionable findings build credibility, support growth, and create lasting impact.